Introduction
I recently ignited an interest for getting better at chess, after getting beaten by my girlfriend too many times even though we were equals not too long ago!! As a Data Engineer I wondered whether I could leverage my chess data to find where my holes were. To combine both my interests in Data engineering and chess I created a full-stack data pipeline that extracts, transforms, and visualizes my personal chess statistics from Chess.com’s API. This project demonstrates my expertise in modern data engineering practices, including containerization, CI/CD, and data modeling.
Architecture & Technology Stack
Architecture Diagram
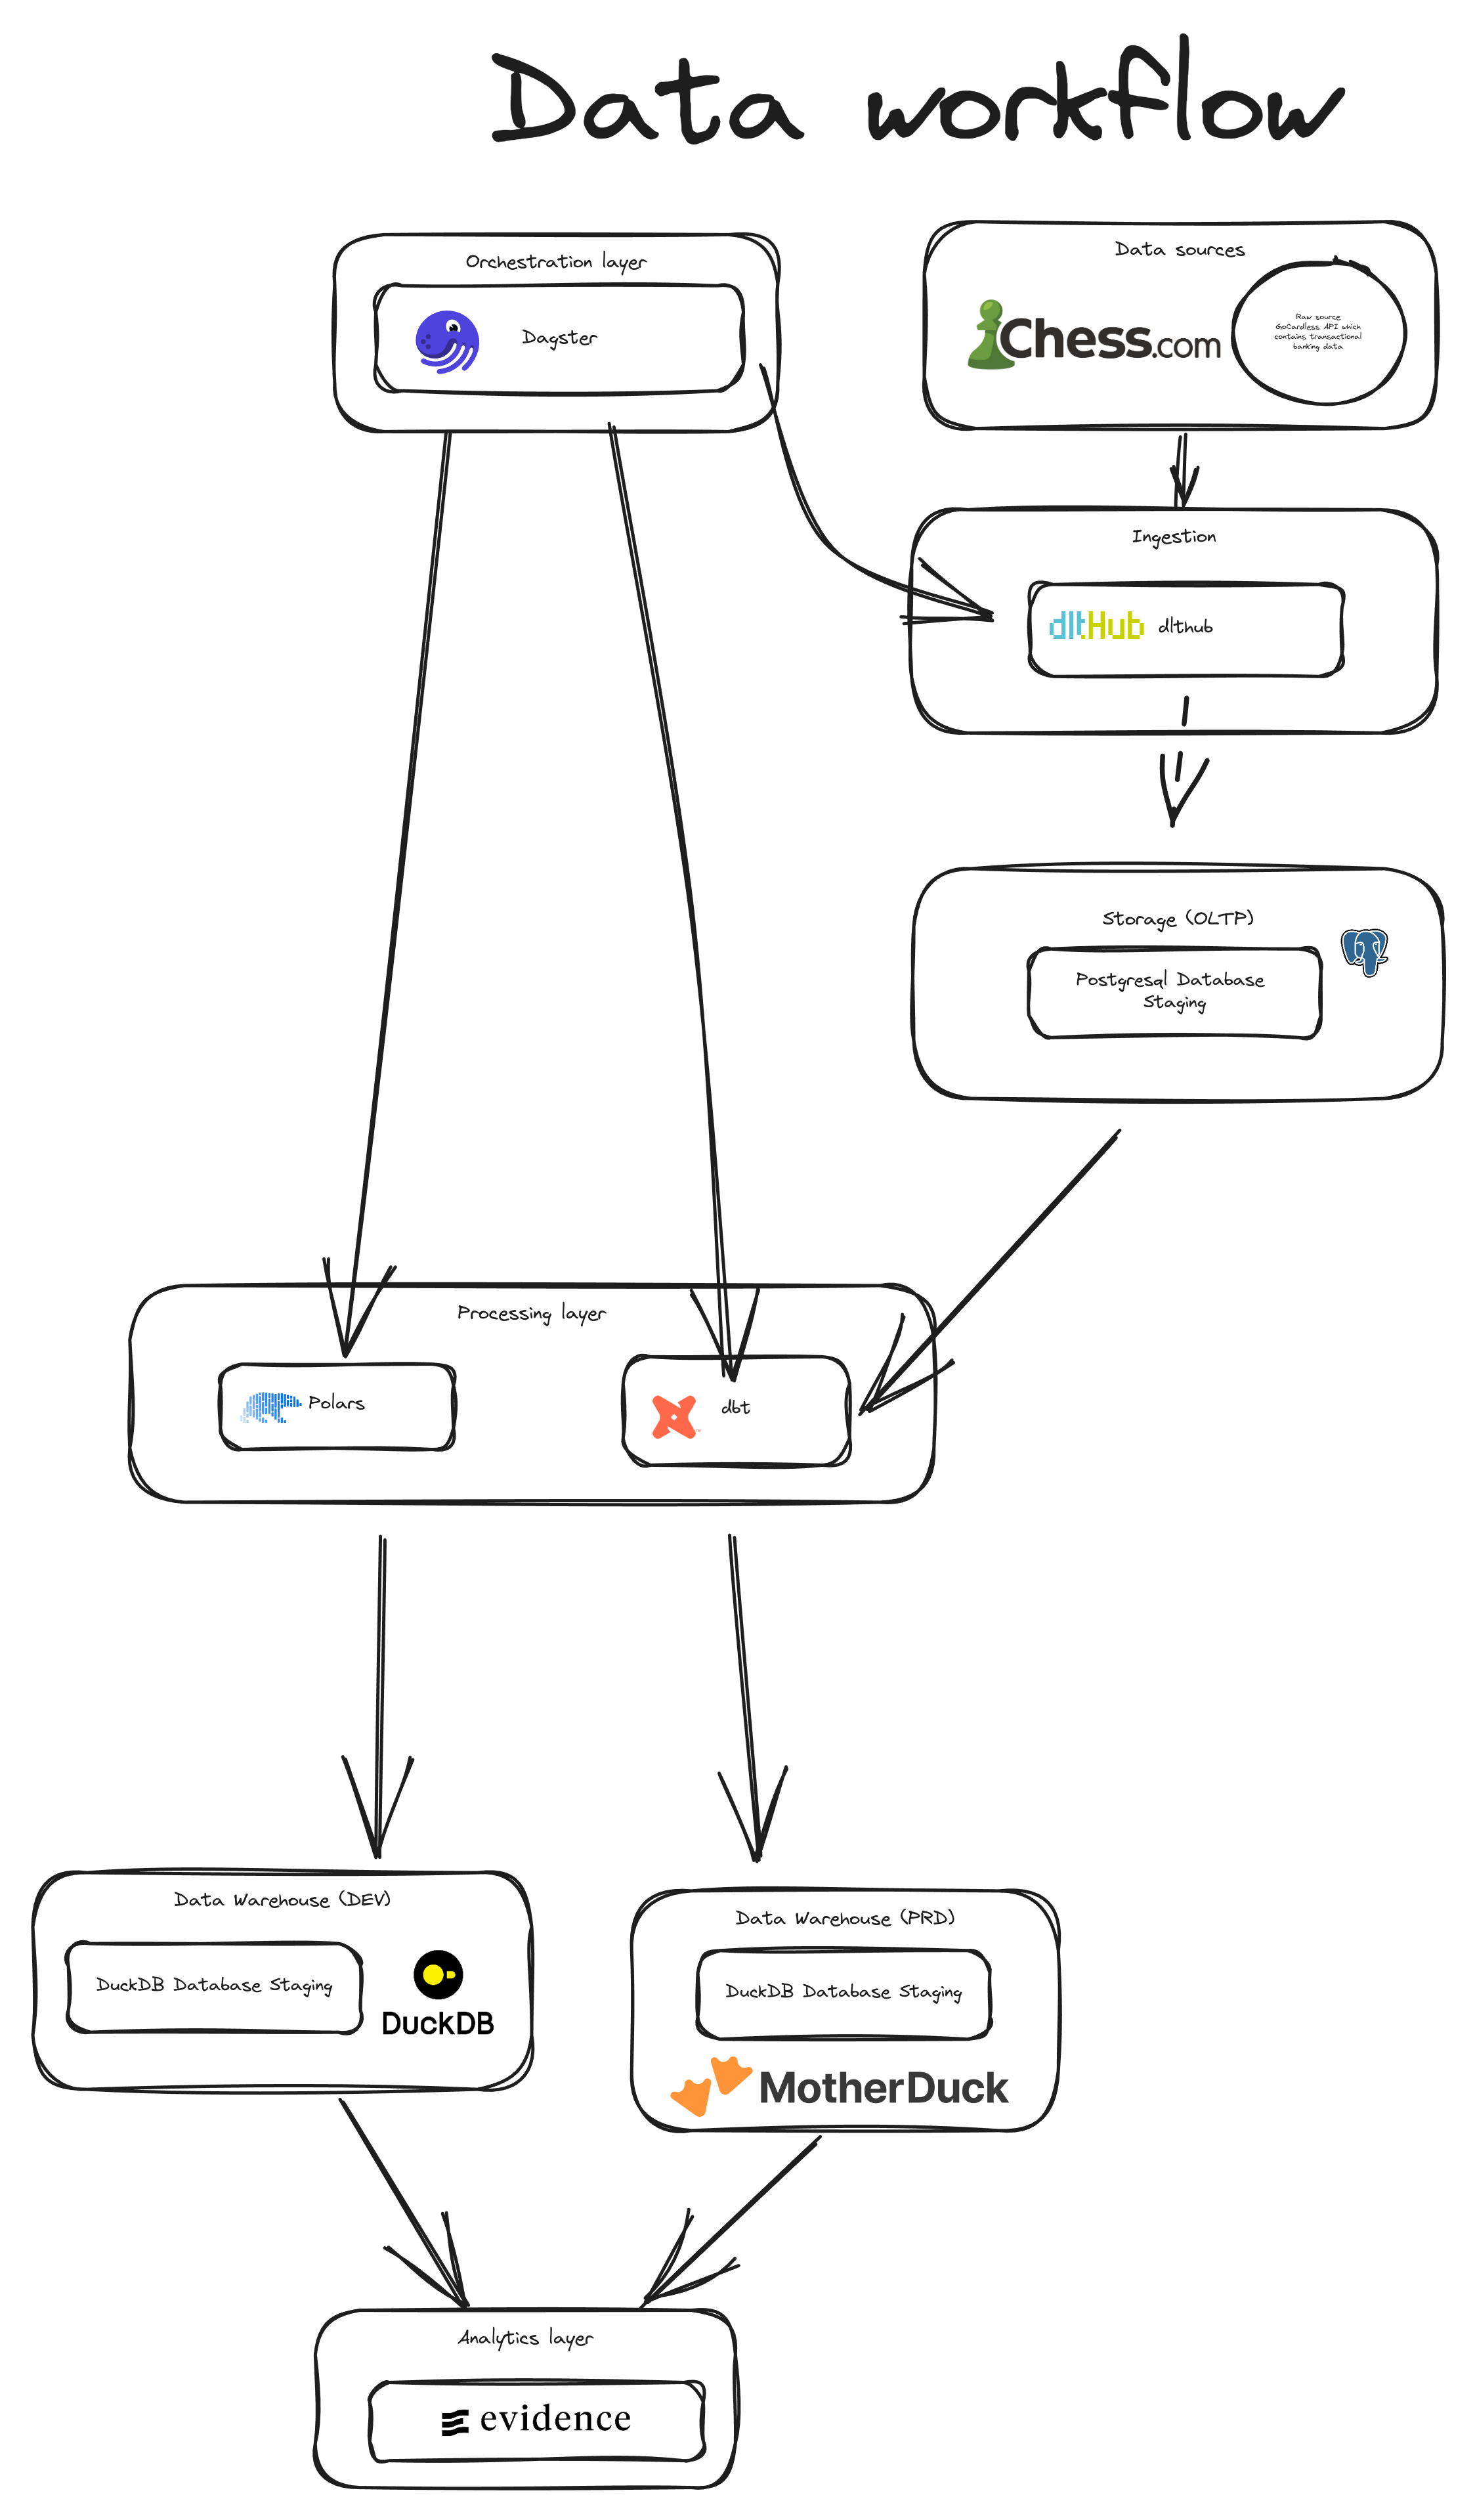
Architecture Diagram
The project leverages several modern data technologies
- Dagster: Orchestration framework for data pipelines
- dbt: Data transformation and modeling
- dlthub: Data ingestion framework
- Docker: Containerization for consistent environments
- GitHub Actions: CI/CD for automated deployment
- PostgreSQL: Raw data storage
- DuckDB/MotherDuck: Database and data warehouse
- Evidence: Business Intelligence tool for visualizations
Project Overview
Chess.com is one of the largest online chess platforms ( and probably the most well known one ), serving millions of players on a daily basis. What makes it particularly interesting (besides getting my chess skills humbled regularly!) is its public API that tracks games, player statistics, and provision of a rich dataset, perfect for analysis.
This project showcases the tools, frameworks, and knowledge I’ve gathered throughout my years while (an attempt on) mirroring a real workspace data environment.
Dashboard
A link to the dashboard can be found here
Environment Setup
I’ve carefully designed separate development and production environments:
- Development: My desktop computer which acts as the development environment with DuckDB for local analytics
- Production: A 24/7 Ubuntu Server 22.04 on a mini-PC running containerized applications with MotherDuck as the analytics database
The separation between environments follows best practices with:
- Environment-specific variables
- No direct development on production servers
- CI/CD deployment through GitHub Actions
Container Architecture
The application is containerized to ensure consistent behavior across environments, similar to how AWS ECS and Fargate might be used in a cloud setting. I’ve deliberately split the application into separate containers:
┌─────────────────┐    ┌─────────────────┐
│                 │    │                 │
│  Dagster        │    │  dbt            │
│  (Generic Data  │    │  (Data          │
│   Stuff)        │    │  Transformation)│
│                 │    │                 │
└─────────────────┘    └─────────────────┘
This approach allows me to develop and deploy changes to one component without interfering with the other, improving development velocity and reliability.
Data Ingestion Process
The Chess.com API provides monthly data endpoints like:
https://api.chess.com/pub/player/melvintran7003/games/2025/04
While the API returns all games for a month in one response, I’ve implemented custom filtering based on the end_time field (Unix timestamp) to enable date-based partitioning. Here’s a sample of the API response structure:
API Output
{
  "games": [
    {
      "url": "https://www.chess.com/game/live/136904677314",
      "time_control": "180",
      "end_time": 1743503115,
      "rated": true,
      "time_class": "blitz",
      "rules": "chess",
      "white": {
        "rating": 245,
        "result": "win",
        "username": "melvintran7003"
      },
      "black": {
        "rating": 223,
        "result": "checkmated",
        "username": "opponent_username1"
      },
      "eco": "https://www.chess.com/openings/French-Defense-Classical-Variation"
    }
  ]
}
The ingestion logic also includes an optimization: when selecting more than 9 days within a month, it queries the entire month’s data instead of filtering by individual days.
Data Transformation
The transformation process follows the modern ELT pattern:
- Raw data lands in PostgreSQL without modification
- Initial cleaning with Polars for lightweight transformations
- dbt models handle business logic and dimensional modeling
- Transformed data is stored in either DuckDB (dev) or MotherDuck (prod)
Pipeline Orchestration
Dagster orchestrates the entire workflow with:
- Jobs for API data retrieval and dbt model execution
- Date-based partitioning for efficient data management
- Daily scheduled runs for fresh data
- Sensors that trigger dbt processing after successful data ingestion
Continuous Integration & Deployment
The project implements a professional CI/CD workflow:
- Development occurs only in the development environment
- Pull requests to the master branch trigger GitHub Actions
- Automated tests validate code quality
- Successful builds deploy changes to the production server
Visualization & Analytics
The transformed data is visualized using Evidence, a self-hosted analytics platform. I selected this over commercial tools like Tableau or Power BI to satisfy my requirement for self-hosting, while finding Apache Superset too complex for this particular use case.
Key Engineering Decisions
Several decisions demonstrate my engineering approach:
- Modular container design: Separating ingestion and transformation logic for independent development
- Environment isolation: Strict separation between development and production
- Partitioned assets: Enable efficient backfills and incremental processing
- Self-hosted infrastructure: Complete control over the entire stack
- Optimized API interactions: Smart filtering based on partition selection
Conclusion
This project showcases my ability to design and implement complete data engineering solutions. While the dataset itself is relatively small, the architecture follows enterprise-grade design patterns that would scale to much larger datasets.
I’m passionate about building robust, maintainable data systems and am always exploring new technologies and approaches. If you’re looking for a data engineer who combines technical expertise with practical implementation, I’d love to connect!